The data centres
Approximately 40m high, with a combined footprint of up to 65,000m² — about nine reference football pitches. Rooftop plant and flues add height.
Explore the height Compare the footprintProposed between Beaconsfield and Gerrards Cross. Here is what’s planned, and what’s still to be decided.
The proposal in 60 seconds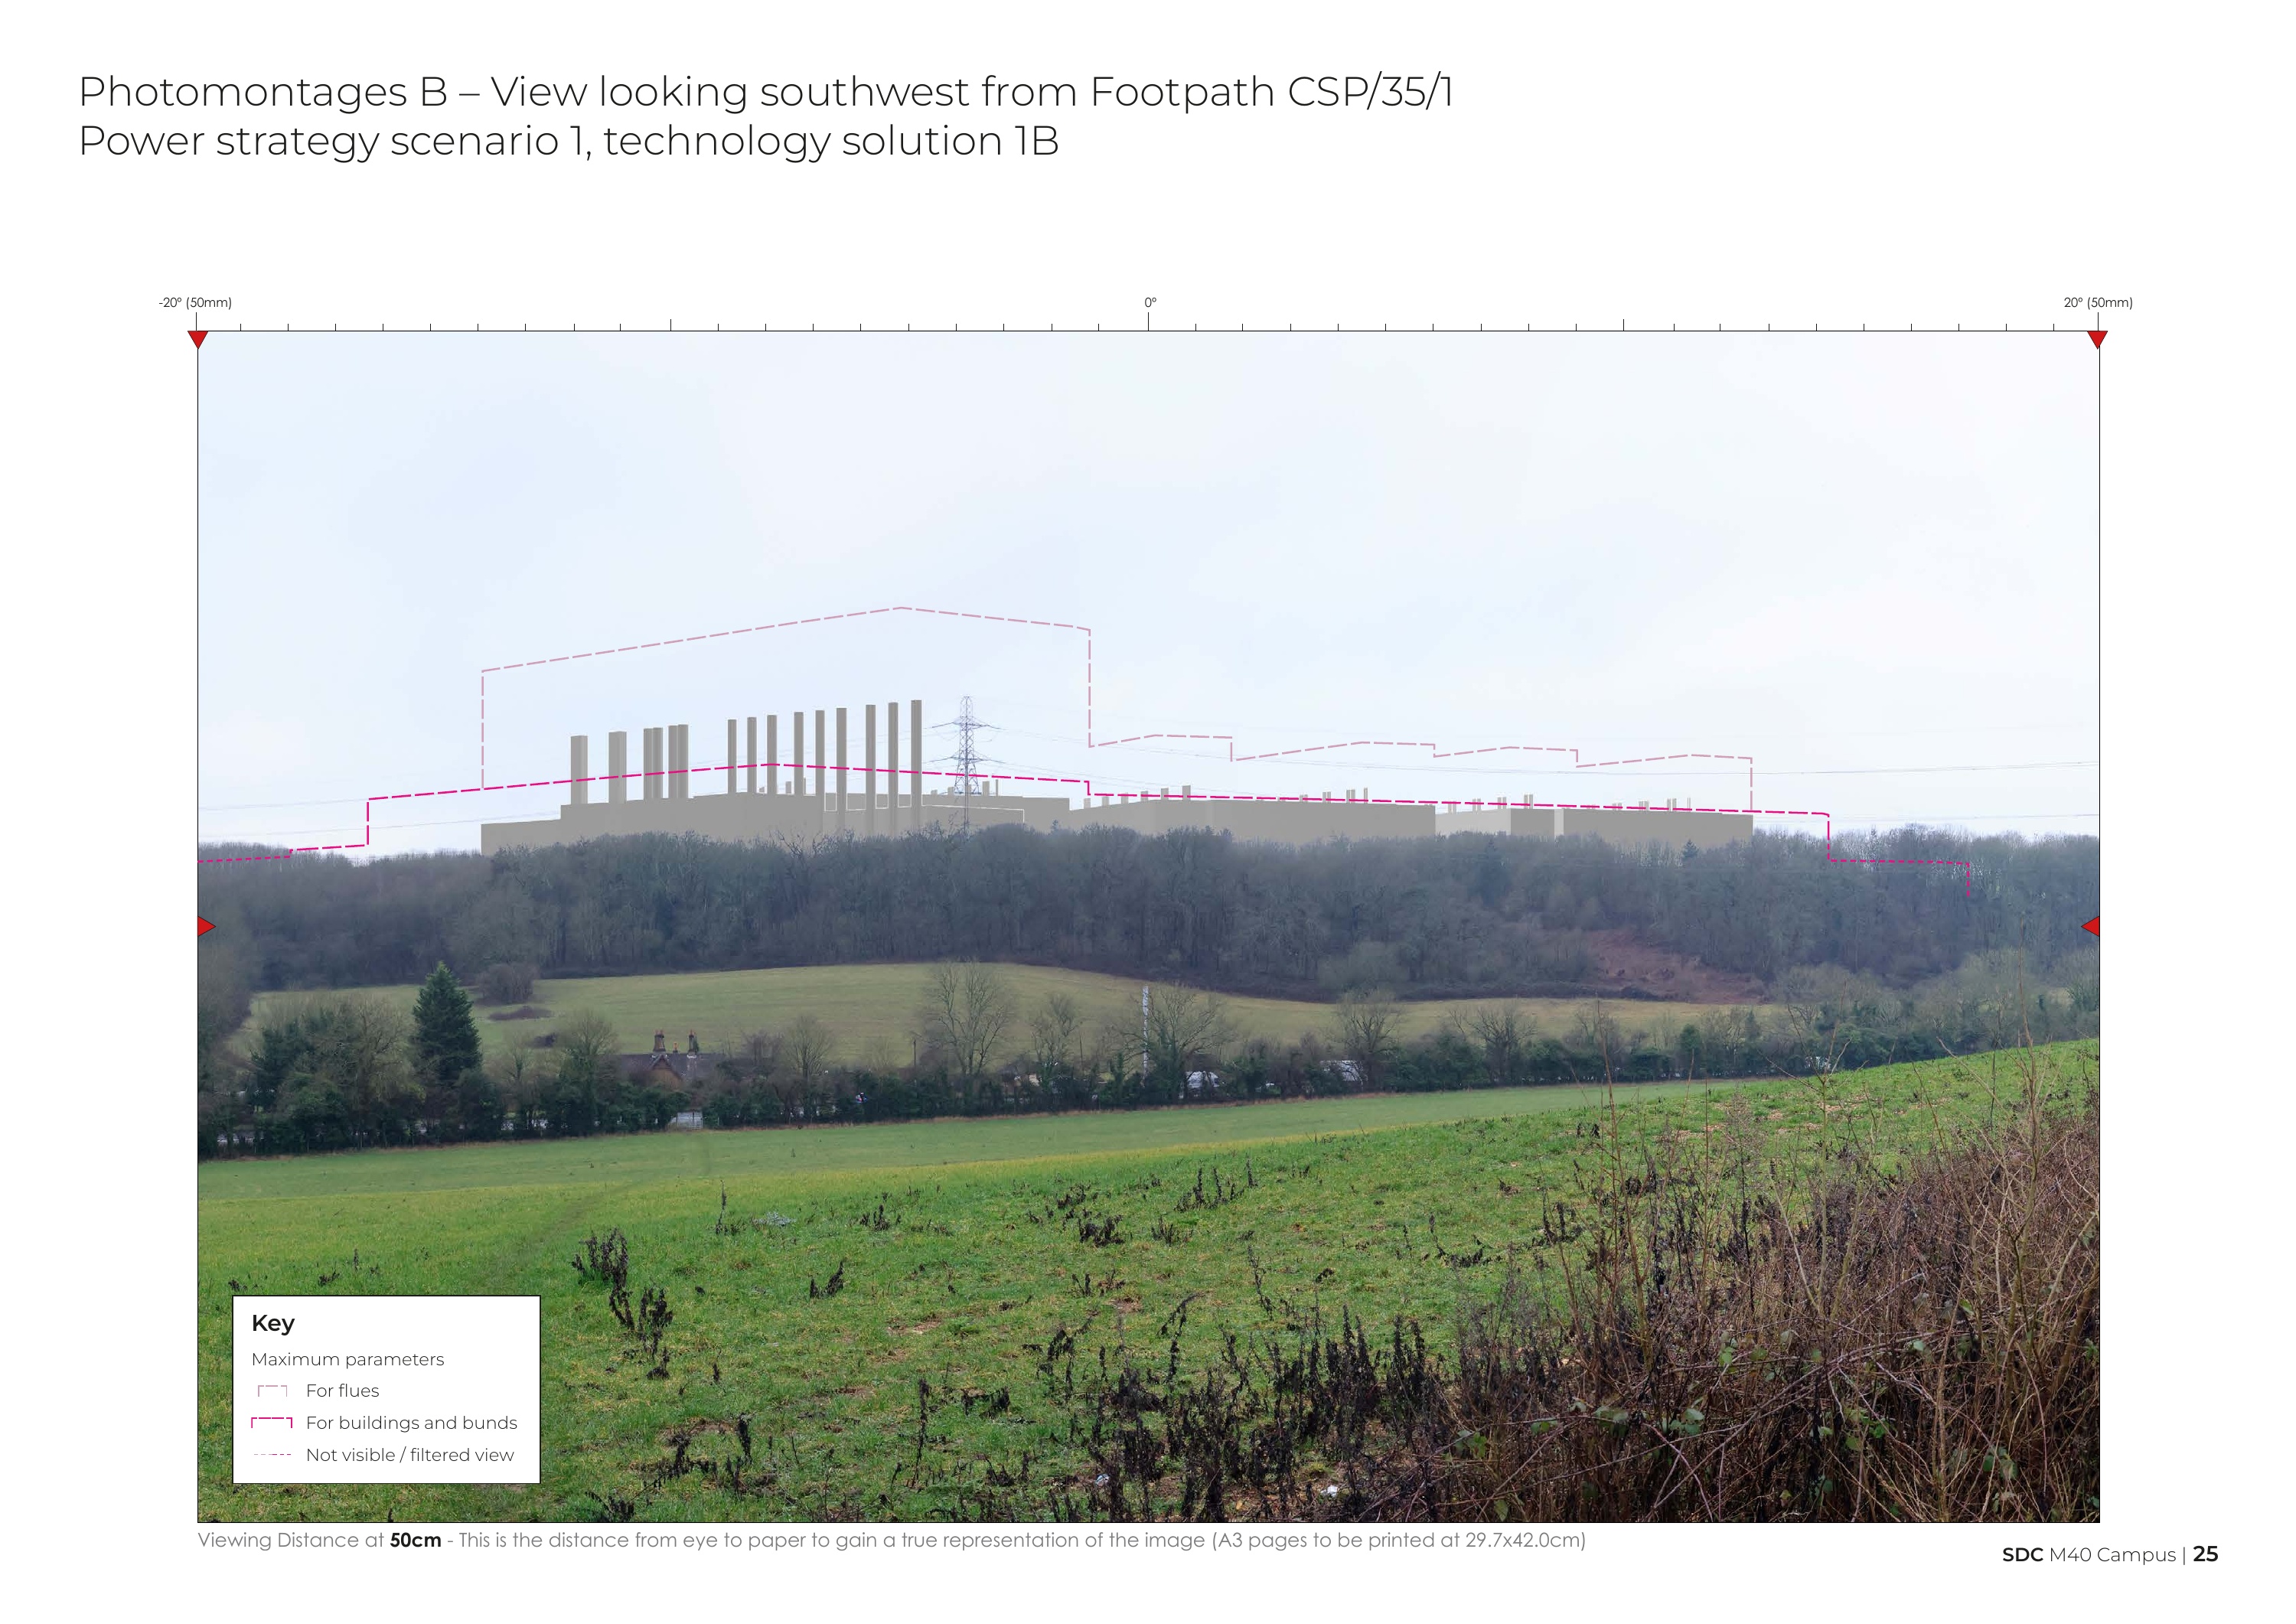
Three data centres, plus the electricity, cooling and backup systems to run them. The power strategy is still being developed.
Approximately 40m high, with a combined footprint of up to 65,000m² — about nine reference football pitches. Rooftop plant and flues add height.
Explore the height Compare the footprintScenario 1 includes on-site gas generation. Scenario 2 connects directly to the transmission grid without that energy centre. Only one scenario would be delivered.
Understand the power options Explore the campusUp to 72 per building, for supply failures and testing.
See the generator count When would they run?The flues rise well above the roofline.
Backup-generator stacks are currently estimated at up to 66m above ground. Their final height is still being tested.
above a 40m building in this comparison
Source: SDC’s Community Consultation Environmental Report, pp. 10, 12 & 33. House height is an illustrative assumption. Terrain, bunding and planting are excluded; this is not a view from a real location.
Explore SDC’s published photomontages from 14 local viewpoints. Compare the power options from the same location.
Looking southwest
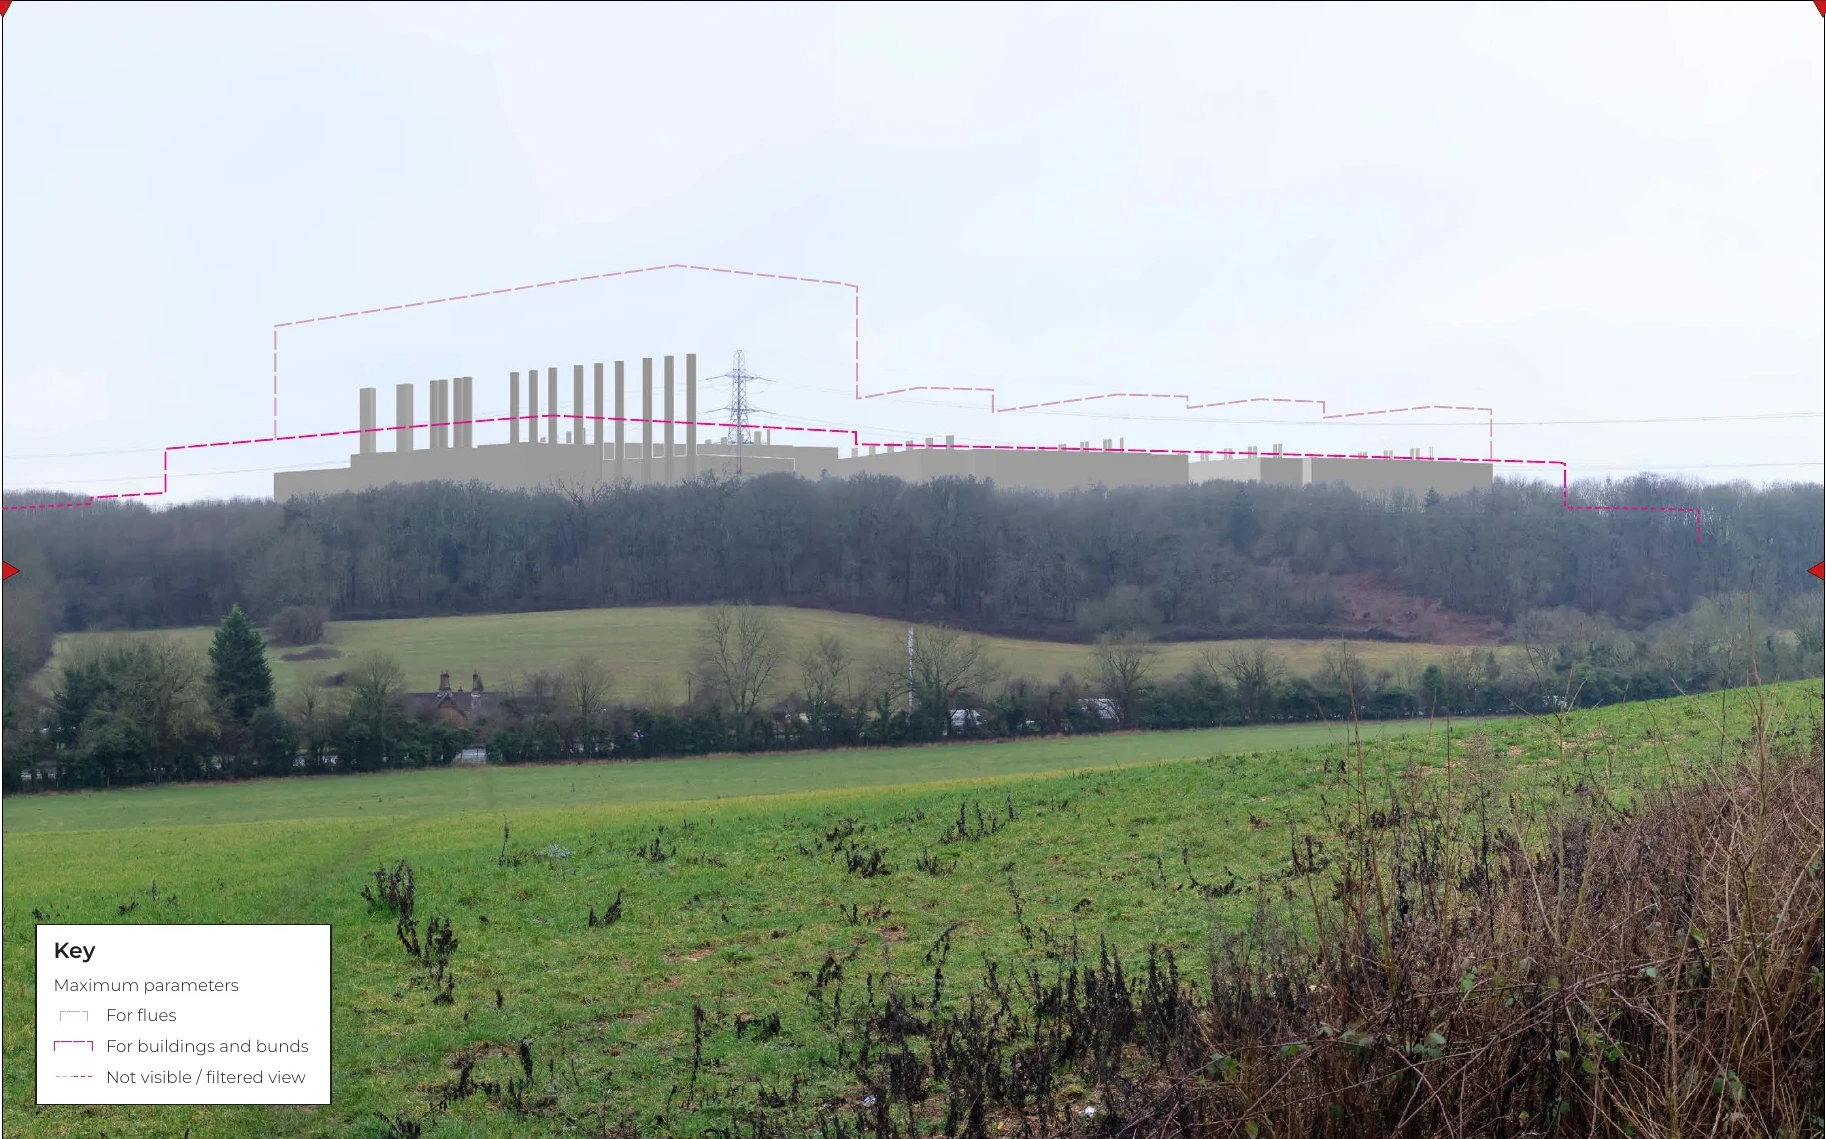
These are proposed views, not photographs of a completed development. Outlines indicate the developer’s maximum parameters; some show structures hidden or filtered by the existing scene.
The maximum envelope shows the extent within which a design could fit. The illustrated technology option may occupy less of it. Read the flue, building and hidden-view lines against the original key.
The pack provides specific print sizes and viewing distances. Cropping, zooming and screen sizes change presentation. Use the original pages for those instructions; the pack also notes presentation limitations for extended panoramas.
These are SDC’s September 2026 consultation illustrations. Technology, final design and planting performance remain subject to further work.
Read the visualisation methodologyThe buildings alone.
The maximum combined building footprint is about 9 football pitches, using a 105 × 68m reference pitch.
That excludes the surrounding roads, substations, energy infrastructure and landscaping.
65,000 ÷ (105 × 68) = 9.10 pitches. This is a reference rectangle, not a claim that all football pitches have the same dimensions.
Area comparison rounded to nine whole pitches. These rectangles do not show the site layout or the proportions of the proposed buildings.
Explore the developer’s indicative campus drawing, then compare what could occupy the power-infrastructure area.
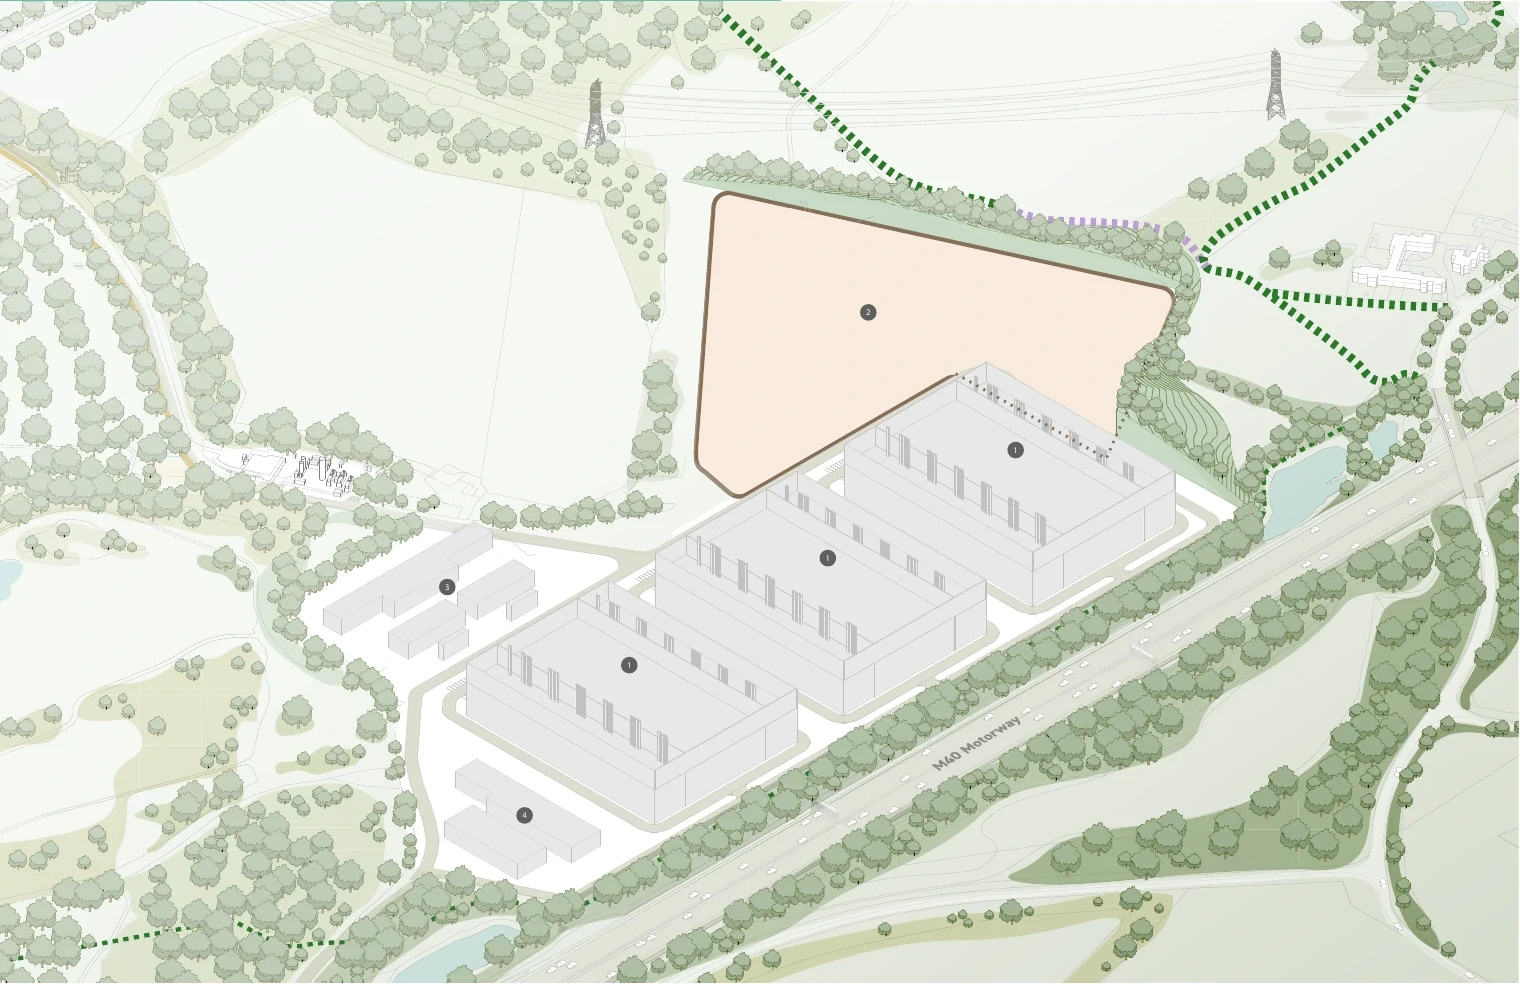
Only one power scenario would be delivered. The three Scenario 1 illustrations show alternative gas-generation technologies; Scenario 2 shows alternative substation designs.

The energy centre occupies the power-strategy area. The final gas-generation technology is still being considered.
Compare the published elevationsOriginal SDC illustration, p.13. Buildings, landscape and power layouts are indicative. Public rights-of-way keys are available on the original page.
Server racks run continuously. Cooling removes their heat; batteries and backup systems help keep them operating through interruptions.
Approximate maximum IT load across the campus. IT load measures power used by computing equipment.
MW describes a rate of power use. MWh describes energy used over time. The IT figure excludes additional facility demand such as cooling. No household-equivalent claim is made here.
One option uses an on-site gas energy centre to supply up to two buildings. SDC anticipates wider grid capacity around 2040; it then assumes the energy centre could operate as a peaking plant.
Gas is supplied to the plant through a pipeline.
Compare the proposed energy centre with UK generating plants closer to its capacity. Fuels and operating patterns differ.
The proposed energy centre has about 67% of this station’s published capacity.
Open-cycle gas turbine · expansion plant only, excluding the adjacent CCGTOperator’s capacity figuresCapacity is a rate of generation, not yearly output, size, emissions or noise. Selected examples, not a ranking. The 300 MW campus IT load is a separate figure.
Figures follow each linked operator source and may use different net/gross conventions. SDC’s net/gross basis is unspecified. Spalding Expansion excludes the adjacent combined-cycle station. Cowes is diesel-fuelled. Final technology and operating hours may differ.
Three groups of standby generators, for supply failures and testing.
Current design assumption, subject to refinement. The count does not imply continuous operation. Read below for fuel, testing and emergency assumptions.
A backup generator is an engine connected to an electrical generator. It burns fuel to make electricity when the normal supply fails, helping keep servers and essential cooling running.
Diesel generators? Diesel is the fuel assumed in SDC’s worst-case air-quality modelling. That is an assessment assumption; the report does not establish the final engine and fuel specification.
The backup generators are kept available for loss of the normal electricity supply. They are separate from the proposed gas energy centre described in section 4, which could supply routine power under Scenario 1.
Equipment status by operating mode; this is not a power-flow or wiring diagram.
While running, diesel engines produce nitrogen oxides, particles, carbon dioxide and other exhaust gases, as well as noise and vibration. Fuel, load, running hours and controls determine the amount.
On page 33, SDC reports potential small exceedances of human-health air-quality thresholds in the 72-hour emergency scenario. SDC argues that these would be acceptable because the event is short and unlikely, and concludes that significant adverse human impacts are not expected. This is the developer’s assessment; the passage is not an Environment Agency approval.
The report also explores selective catalytic reduction (SCR), an exhaust treatment that reduces nitrogen oxides. This remains under consideration and can release residual ammonia, which also needs assessment for sensitive habitats.
Environment Agency guidance for applicable emergency diesel installations calls for testing to be minimised, below 50 hours per year, and one engine at a time. It also advises against testing during poor air quality and requires emissions-optimised engines or suitable exhaust treatment. This guidance does not establish SDC’s final test schedule or permit conditions.
Which engines and fuel, how long each test lasts, how many units run together, and which noise and exhaust controls would be secured.
Fans, pumps, transformers and generation equipment can create different kinds of sound. Night-time background levels, tones, intermittency and duration all matter.
Illustrative audio. These are synthesised examples, not recordings of this site or predictions of what you would hear at home.
A synthetic fan-like sound. Listen for the continuous wash of air, spread across many frequencies.
Start with your device volume low.
These samples demonstrate steady, tonal and fluctuating sound. They do not reproduce the proposed equipment, its loudness, distance, night-time conditions or mitigation. The examples are not matched for perceived loudness. Speakers, headphones and volume settings change what you hear; small speakers may not reproduce low tones well.
A reliable site demonstration would need measured equipment spectra, operating assumptions, background sound and a validated acoustic model for a stated listening location. This player has no calibrated decibel level.
SDC says noise modelling is ongoing and identifies silencers, enclosures and other mitigation.
Does the assessment address sound character as well as overall levels, especially at night and when several sources operate together?
Fuel, engine load, running time and exhaust treatment determine emissions. Weather and stack design affect concentrations at homes and sensitive habitats. Routine power, testing and emergency operation need separate assessment.
NOₓ / NO₂ Combustion-related gases; nitrogen dioxide is regulated for its health effects.
PM₁₀ / PM₂.₅ Inhalable particles around 10 or 2.5 micrometres and smaller.
CO₂ A greenhouse gas produced by burning fuels such as natural gas and diesel. A different issue from local particle concentrations.
Other exhaust gases Combustion can also produce carbon monoxide and unburnt hydrocarbons; amounts depend on the fuel, engine and controls.
Diameter comparison. No concentration or health effect is depicted.
The 72-hour emergency case is explained in the backup section.
SDC describes a programme of no less than 9 years, starting in 2028 if consented, but also gives approximately 2035 as the earliest completion.
Those dates do not clearly reconcile. Residents should ask for a consistent programme, including overlapping phases.
Conceptual overlap only. Bar lengths do not predict individual phase dates.
Traffic, dust, vibration, earthworks, noise and temporary lighting are potential effects requiring controls. SDC proposes construction access from the A40 and a management plan.
Planting takes time to establish. Drag directly across the image to compare SDC’s completion and year-15 illustrations; both include the proposed development.
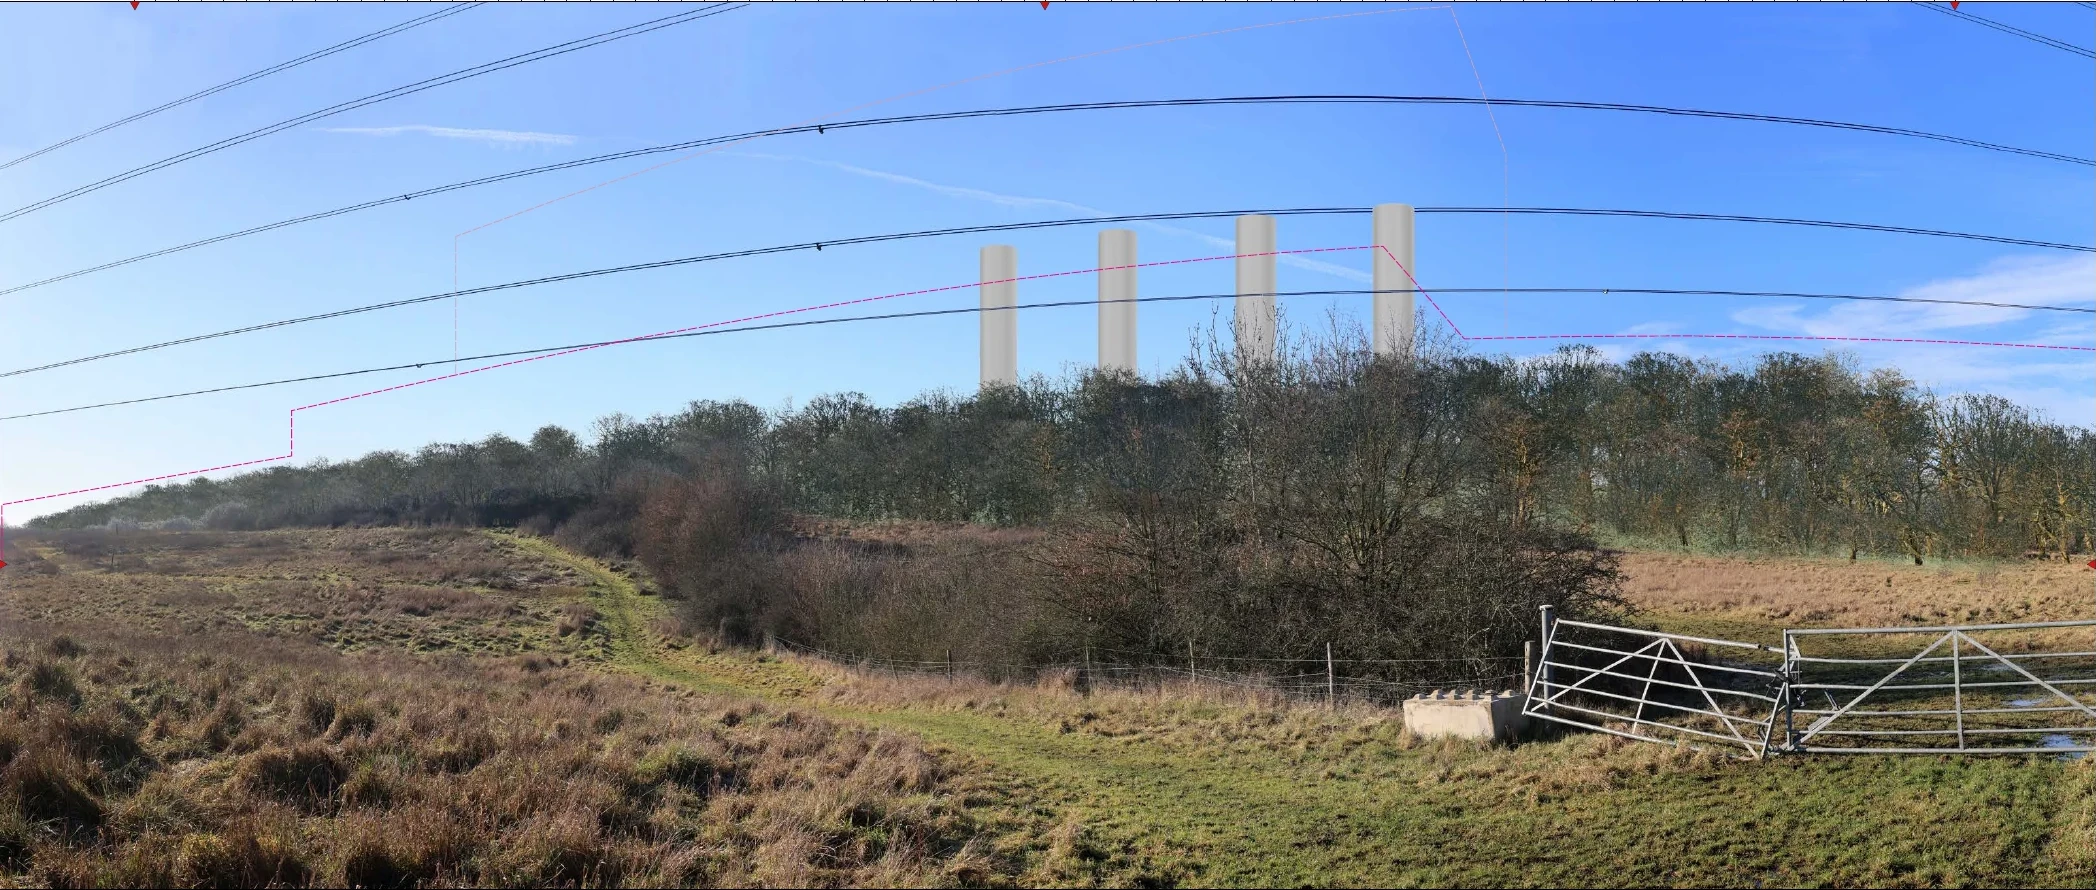
 On completionYear 15
What remains visible? Compare the roofline and flues as well as the planting. These are the developer’s assumed outcomes, not a guarantee of future screening. Scenario 1, technology 1A is held constant.
Follow the developer’s section drawing from the existing terrain to the proposed earthworks and planting.

The dotted line records the existing landform in SDC’s section toward Moat Farm.
SDC proposes excavating building platforms, planted embankments and retained vegetation to reduce visibility.
What do the views show before planting matures? What remains visible, and how will planting be maintained or replaced?
A campus this size needs security, vehicle and construction lighting. In open Green Belt countryside, every light counts. Ask where it points, when it runs, and how glow would be kept off the sky.
Illustration only, not a lighting prediction.
Explore the developer’s original plans for the land, infrastructure and surroundings. Each map keeps its own boundaries and key.
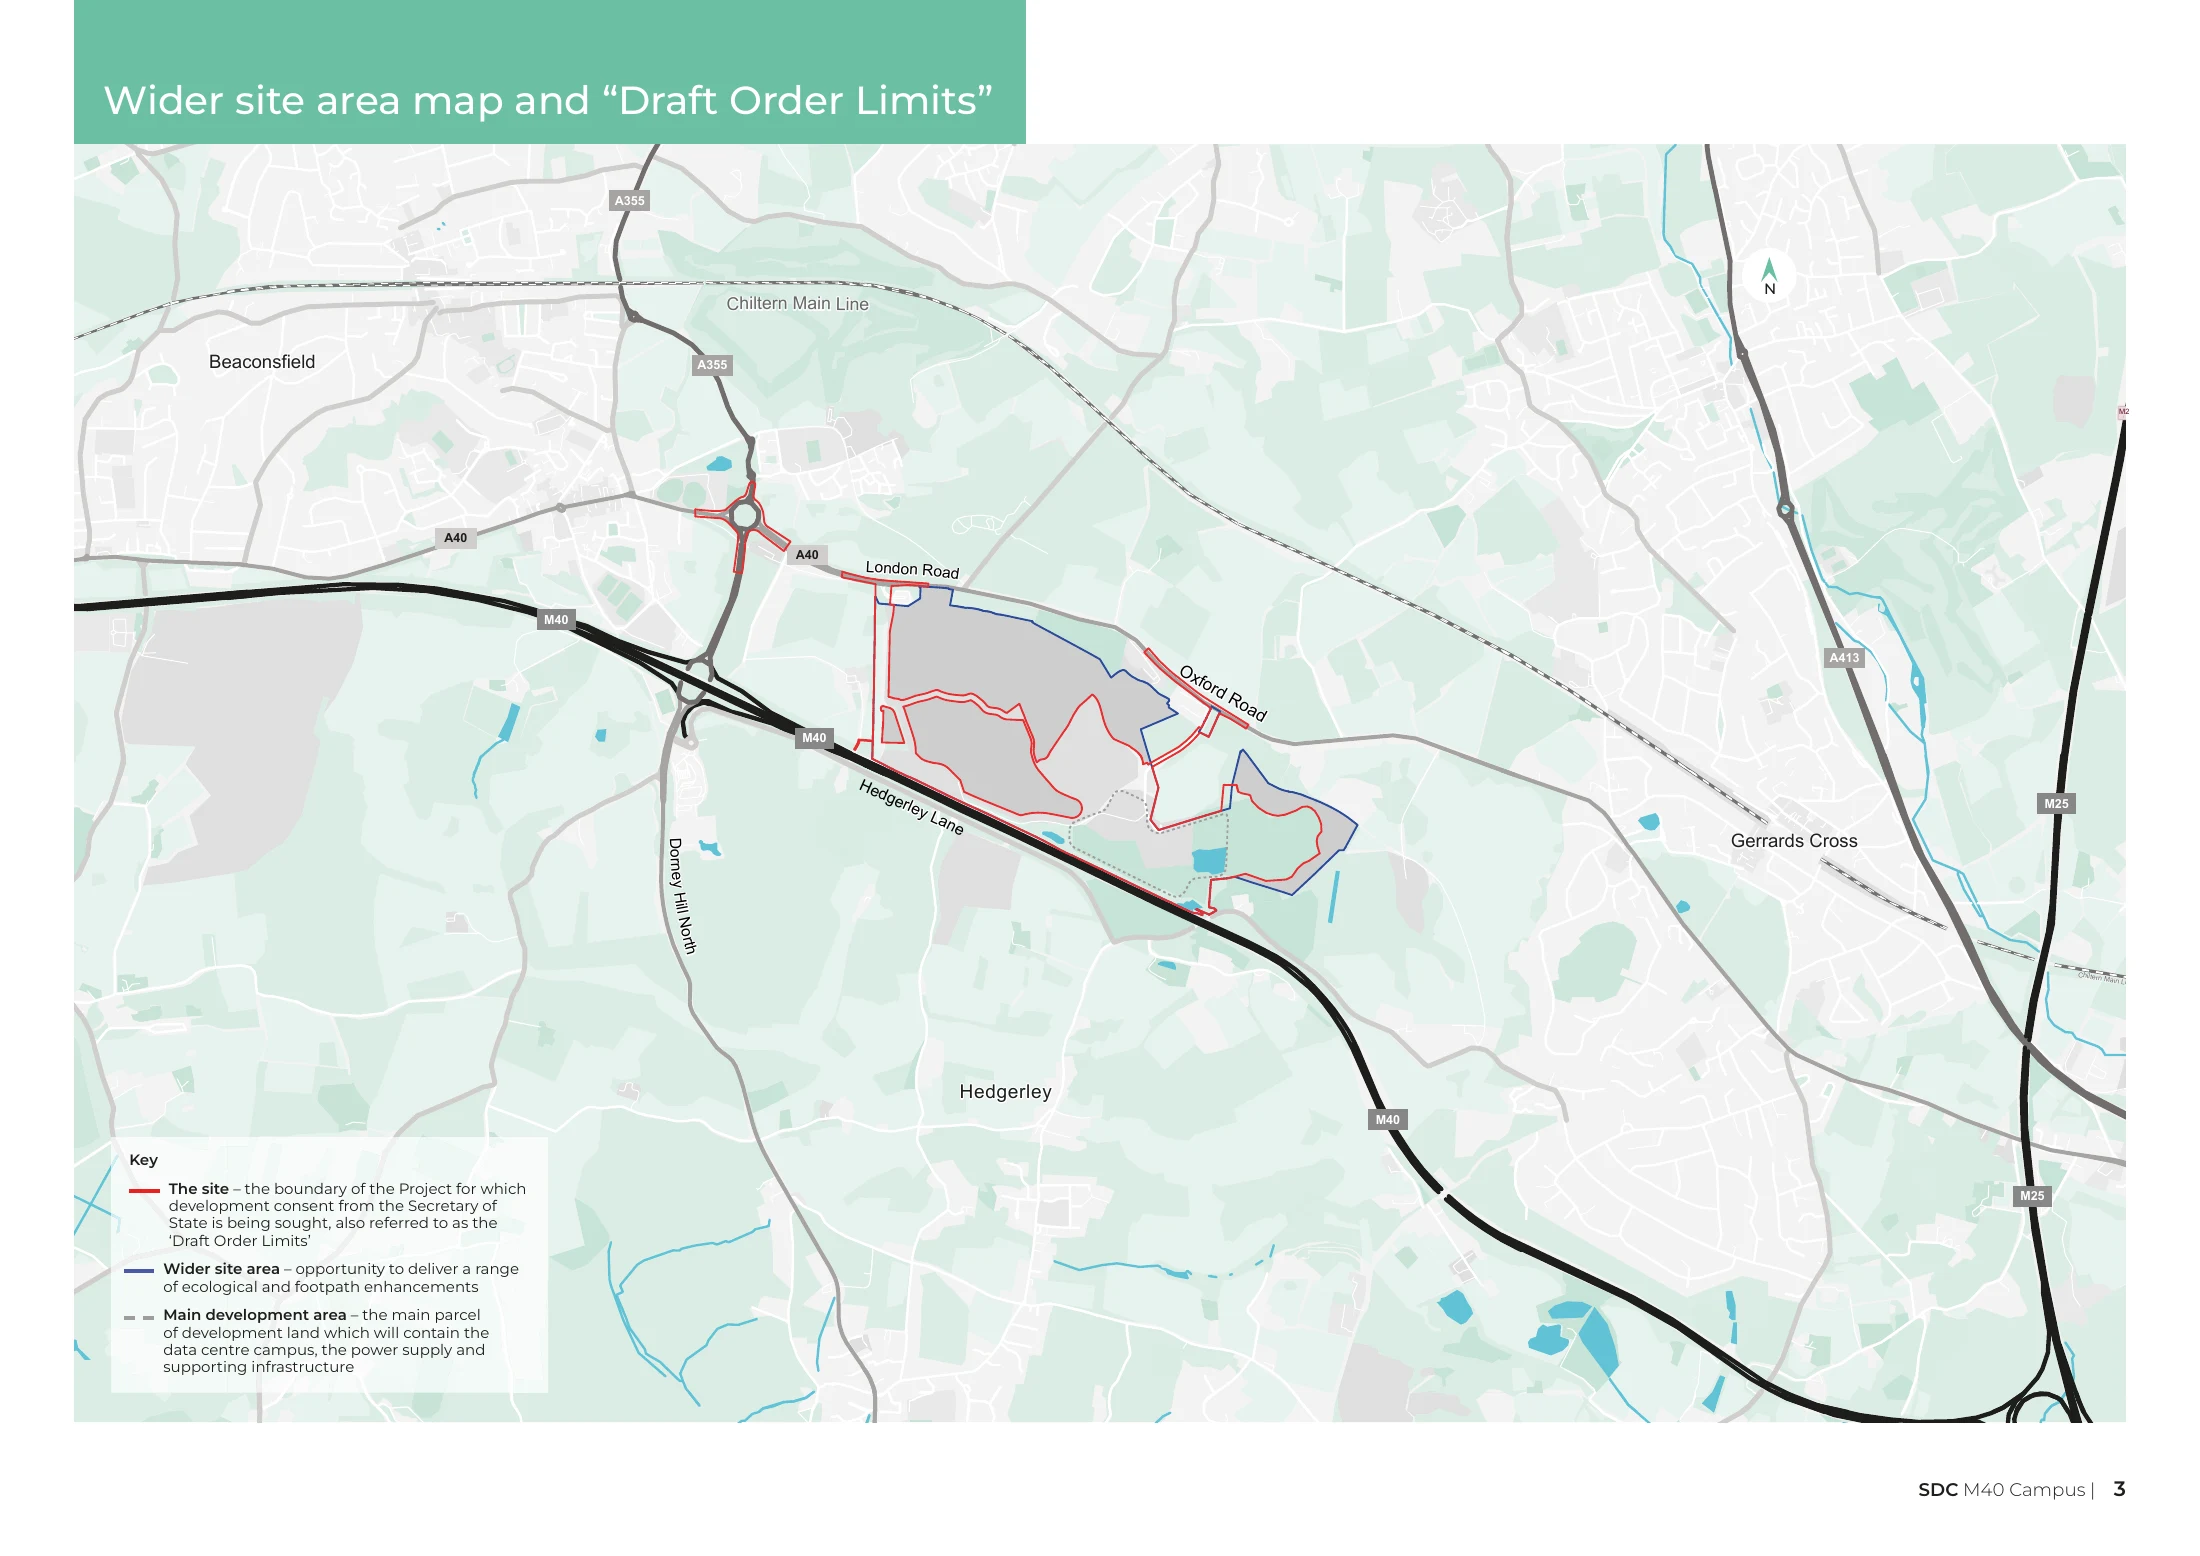
Select a topic to change the original map. These are separate published plans, not precisely registered overlay layers. Zoom and scroll for detail.
Open SDC’s interactive maphyperscale buildings
40mapproximate maximum height
65,000m²maximum combined footprint
300MWapproximate maximum IT load
216potential backup generators
200MWapproximate gas capacity, Scenario 1
9+years in SDC’s programme statement
Read the proposal alongside its assumptions: the final design, operating conditions and predicted local effects remain central to understanding the scheme.

